

Casablanca weather by month is generally mild in winter and warmer, much drier in summer, according to the World Meteorological Organization’s climate averages. The figures can help you plan clothing and outdoor time, whether you’re walking through the city or heading to the coast; Washington Hotel is a four-star hotel in central Casablanca.
- Winter daytime averages range from 17.6°C in January to 18.9°C in December.
- July and August are the warmest months in the monthly averages, with mean highs of 26.1°C and 26.7°C.
- June through August each average two rain days per month.
- November has the highest average monthly rainfall: 82.5 mm.
How Casablanca’s seasons feel
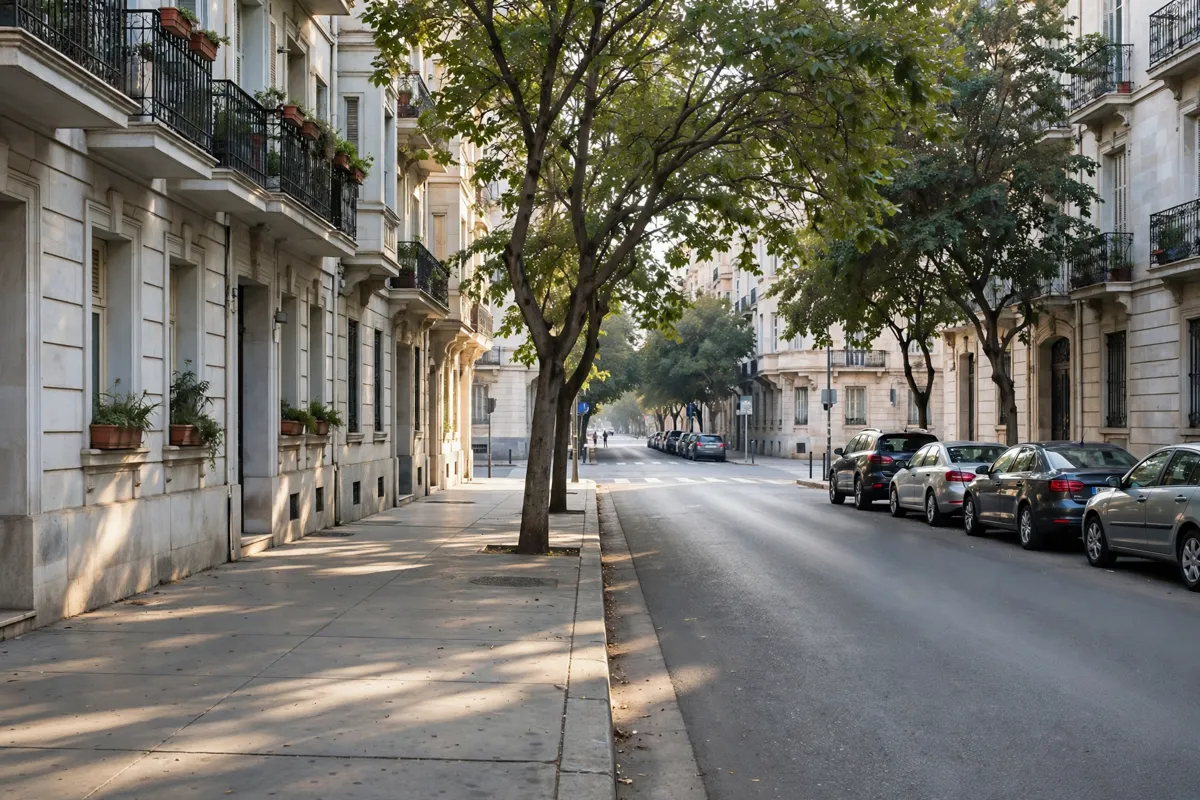
Casablanca’s monthly averages show a gradual rise in temperature from winter into summer, followed by a cooler, wetter autumn.
The WMO figures use the 1991–2020 climate-normal period. They show mean daily minimum and maximum temperatures alongside monthly rainfall and average rain days, making it easier to compare the shape of the year rather than rely on a single forecast. The WMO cautions that the averaging period and definition of a rain day can differ between countries.
For a quick overview, January is the coolest month by average daytime high, while August is the warmest. Rainfall is concentrated more heavily in the cooler part of the year: the monthly average reaches its peak in November, then falls to less than 1 mm in each of July and August. These are climate averages, not promises about conditions on a particular day.
Winter months and coastal conditions
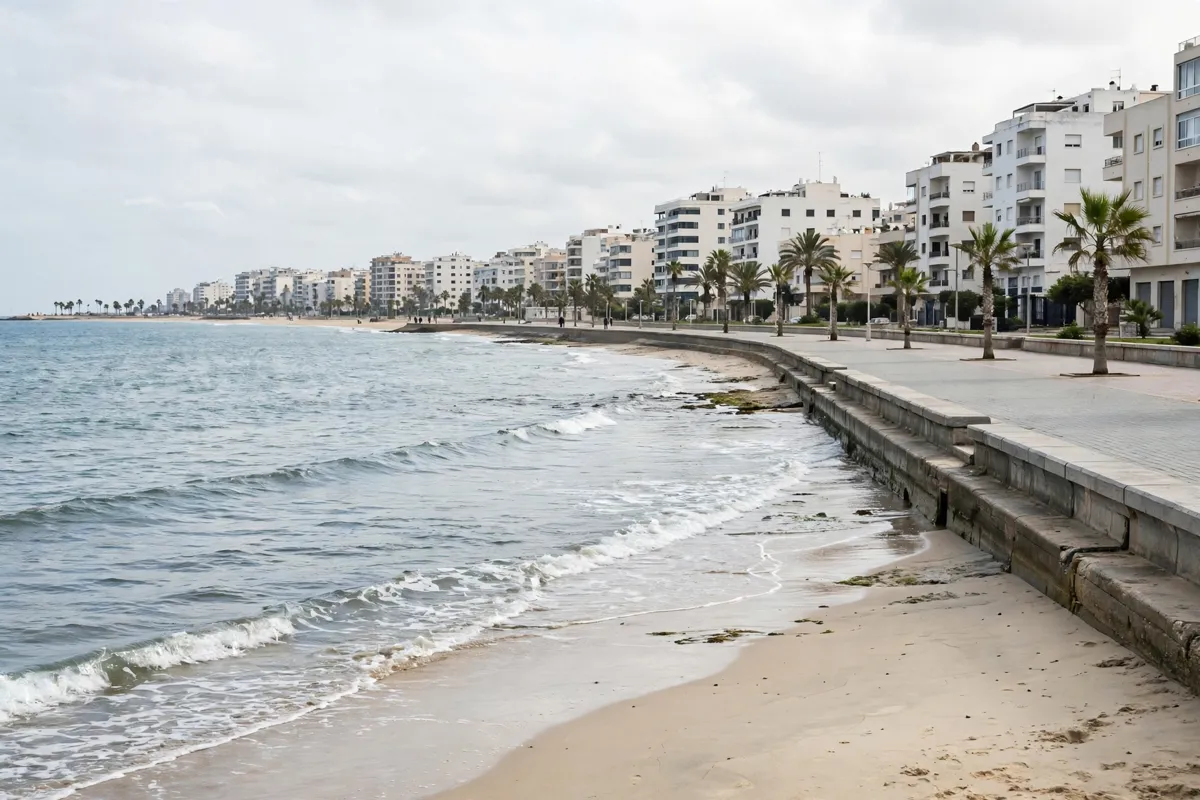
Winter in Casablanca has mild average daytime highs, cooler nights and more frequent rain than summer.
January averages 8.9°C for the daily minimum and 17.6°C for the maximum, with 63.9 mm of rainfall across an average of 9.0 rain days. February is slightly warmer and drier: its mean minimum and maximum are 9.7°C and 18.1°C, while average rainfall is 49.7 mm over 8.0 rain days.
December averages 10.5°C at night and 18.9°C by day. Its mean rainfall is 64.1 mm, with 9.0 rain days. For a trip in Casablanca in December, pack a layer for cooler evenings and something suitable for rain; the monthly figures indicate both are worth allowing for.
November is the wettest month in the averages, with 82.5 mm of rainfall and 9.0 rain days. Its mean daily temperatures range from 12.8°C to 21.0°C. For a day that combines central streets with the shoreline, you can use a Casablanca city-centre-to-coast itinerary to shape the route around the forecast.
Spring and early summer
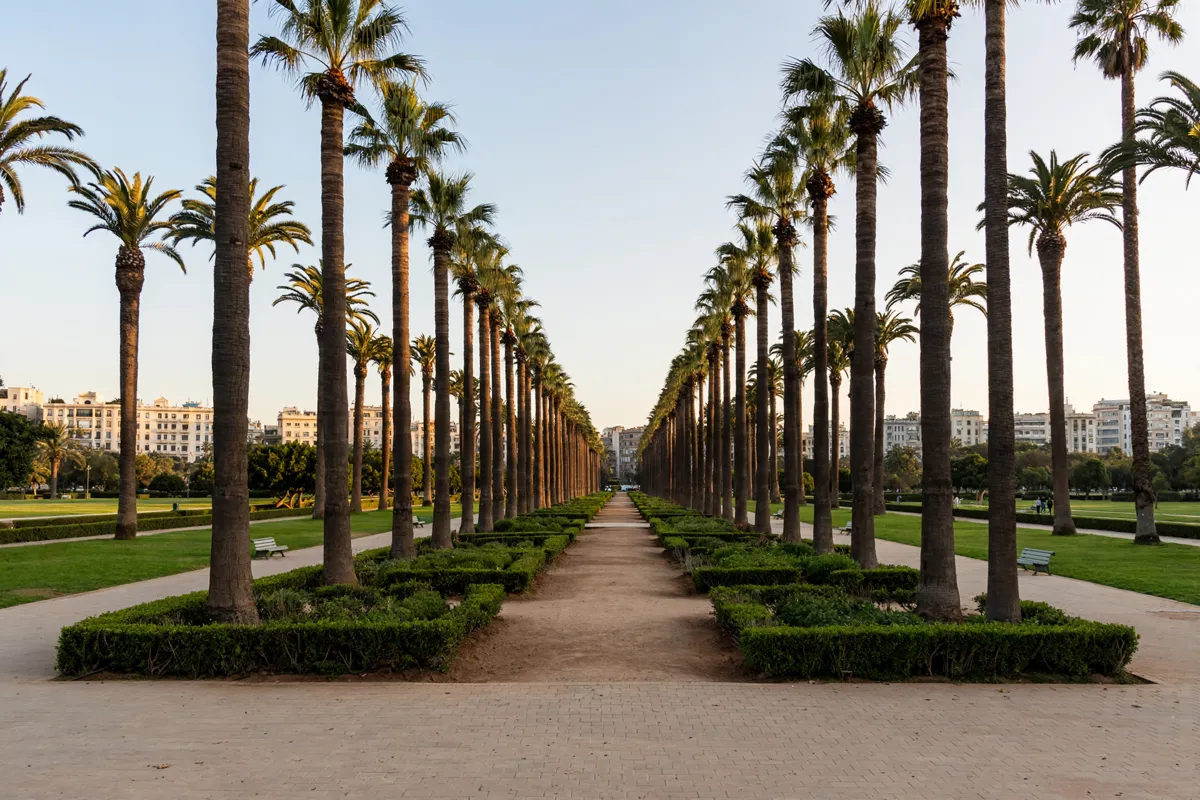
Spring brings steadily warmer monthly averages and declining rainfall, with especially dry conditions by June.
March averages 11.6°C for the daily minimum and 19.7°C for the maximum; rainfall averages 42.5 mm across 9.0 rain days. In April, the averages rise to 13.3°C and 20.6°C, while rainfall drops to 33.5 mm and rain days average 8.0.
May marks a clearer shift toward drier weather. Its mean daily temperatures are 16.0°C and 22.7°C, with 13.6 mm of rainfall and 5.0 rain days on average. June averages 18.7°C to 24.6°C, just 2.5 mm of rainfall and 2.0 rain days.
If you’re planning outdoor time in spring, these figures point to a useful transition: cooler evenings early in the period, warmer days later, and less average rain as the months progress. Check the forecast close to your dates when deciding how much rain protection to bring.
Late summer and autumn
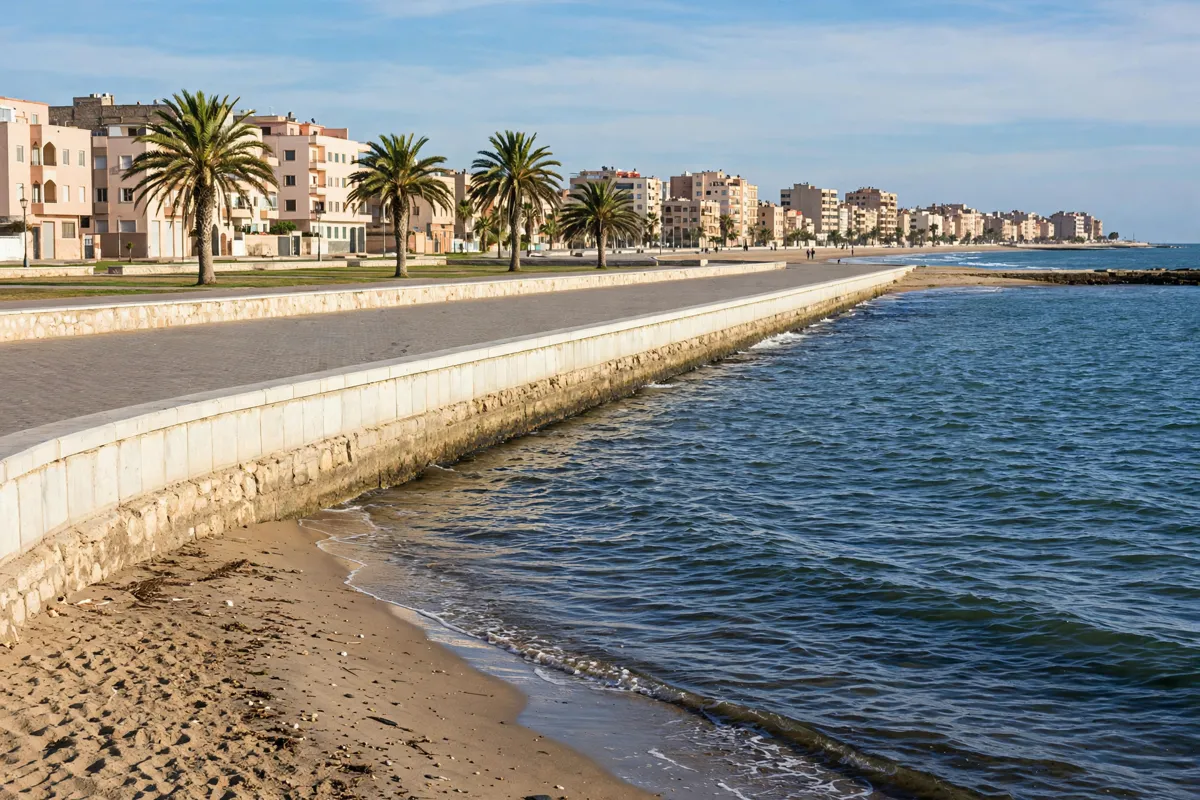
Late summer is warm and very dry on average, while autumn brings a gradual return of cooler nights and more rainfall.
July has a mean minimum of 20.5°C and maximum of 26.1°C, with 0.5 mm of average rainfall and 2.0 rain days. August is the warmest month in the figures: daily minimum and maximum averages are 21.0°C and 26.7°C, and mean rainfall is 0.4 mm over 2.0 rain days.
September remains warm, averaging 19.5°C to 25.8°C, but rainfall rises to 11.7 mm and 3.0 rain days. October cools further, with mean daily temperatures of 16.8°C to 24.3°C; average rainfall increases to 45.3 mm over 7.0 rain days.
As autumn plans take shape, you can pair outdoor outings with Casablanca’s annual festivals and sport calendar, while checking event details for your travel dates. The monthly averages describe broad patterns, so use a current forecast to make day-by-day choices.
What to pack for a city stay
Pack for the month’s average temperature range and rainfall, and leave room for layers that work across cooler evenings and warmer afternoons.
In the cooler, wetter months, a light warm layer and rain protection are practical choices based on the monthly averages. In May and June, rainfall averages fall considerably compared with winter, but evenings still average below daytime highs.
For July through September, the temperature figures support lighter clothing for daytime, with a layer available for cooler parts of the day.
The WMO figures are climate normals, not a day-specific forecast. Morocco’s Direction Générale de la Météorologie lists climatological data, climate normals and absolute records among its climate products; check the official site before you go.
FAQs
Which month is warmest in Casablanca?
August has the highest mean daily maximum in the monthly averages, at 26.7°C.
When is Casablanca driest?
August has the lowest mean rainfall in the monthly figures, at 0.4 mm. July is also very dry, averaging 0.5 mm.
Is Casablanca rainy in winter?
Rain is more frequent in the cooler months than in midsummer. November has the highest average monthly rainfall in the figures.
Are these figures a forecast?
No. They are climate averages based on a 30-year period, so actual conditions can vary from day to day.